Networks are under pressure
I see few articles that make use of the RIN statements that the AER requires the distribution and transmission businesses to submit. To be fair the data has historically been submitted as spreadsheets and was hard to work with.
And without pointing any fingers at anyone the latest data available is still for FY24 and we are now in January 2026. It’s understood the delay with ’25 data is because the AER has changed the system, but when 20 authors can cooperate to release in early Jan ’26 a comprehensive, well-written article on global ocean heat content changes in 2025, you might think Australia does indeed have a productivity problem.
In any event thanks to modern technology I’ve had a second go at downloading all the “Economic Benchmarking” workbooks for each of the electricity distributors in the NEM and moved all the data into a database that can be queried. LLMs have made such tasks easier (I use Claude). A caveat: converting many workbooks with differing column formats into a database leaves room for error. I’ve done various tests and my 15-20 years analysing network valuations helps me spot inconsistencies, but mistakes may remain.
Historically network investors used to have an EV:RAB ratio as a rule of thumb valuation tool. That is you would pay say 1.15X the estimated value of the regulated asset base (RAB). Why would you do this? Basically because for one reason and another your WACC (weighted average cost of capital) was lower than the regulator allowed, and because to a small extent you could game the regulator and because you would capitalise future growth in customer numbers.
Over the years though the regulator has made it more difficult, particularly since the grounds for appealing decisions to the Competition Tribunal have been greatly reduced and also because some sort of basis to allow for actual interest costs has been agreed. I discuss an alternative approach - capitalising network costs into house prices - later in this note.
AEMC and policy makers should prioritise household and business electrification
The AEMC has historically been most driven by “fairness” and “efficiency”. But these days:
The carbon objective in Australia’s National Electricity Law (NEL), as part of the broader National Energy Objectives (NEO), is to consider and facilitate
emissions reduction targets set by participating jurisdictions
I would argue that network pricing rules need to deeply embed this relatively recent objective. The key question is: what policy and prices for networks would most incentivise household electrification?
Some considerations:
- Fairness matters, but so does fairness to future generations
- Monopolies and efficiency don’t go hand in hand - efficiency would be better served by incentivising competition within the network
- I’m not convinced that either a revenue cap or a price cap produce the best long-term results
Transmission supplied volumes down 10% despite 6% growth in customer numbers
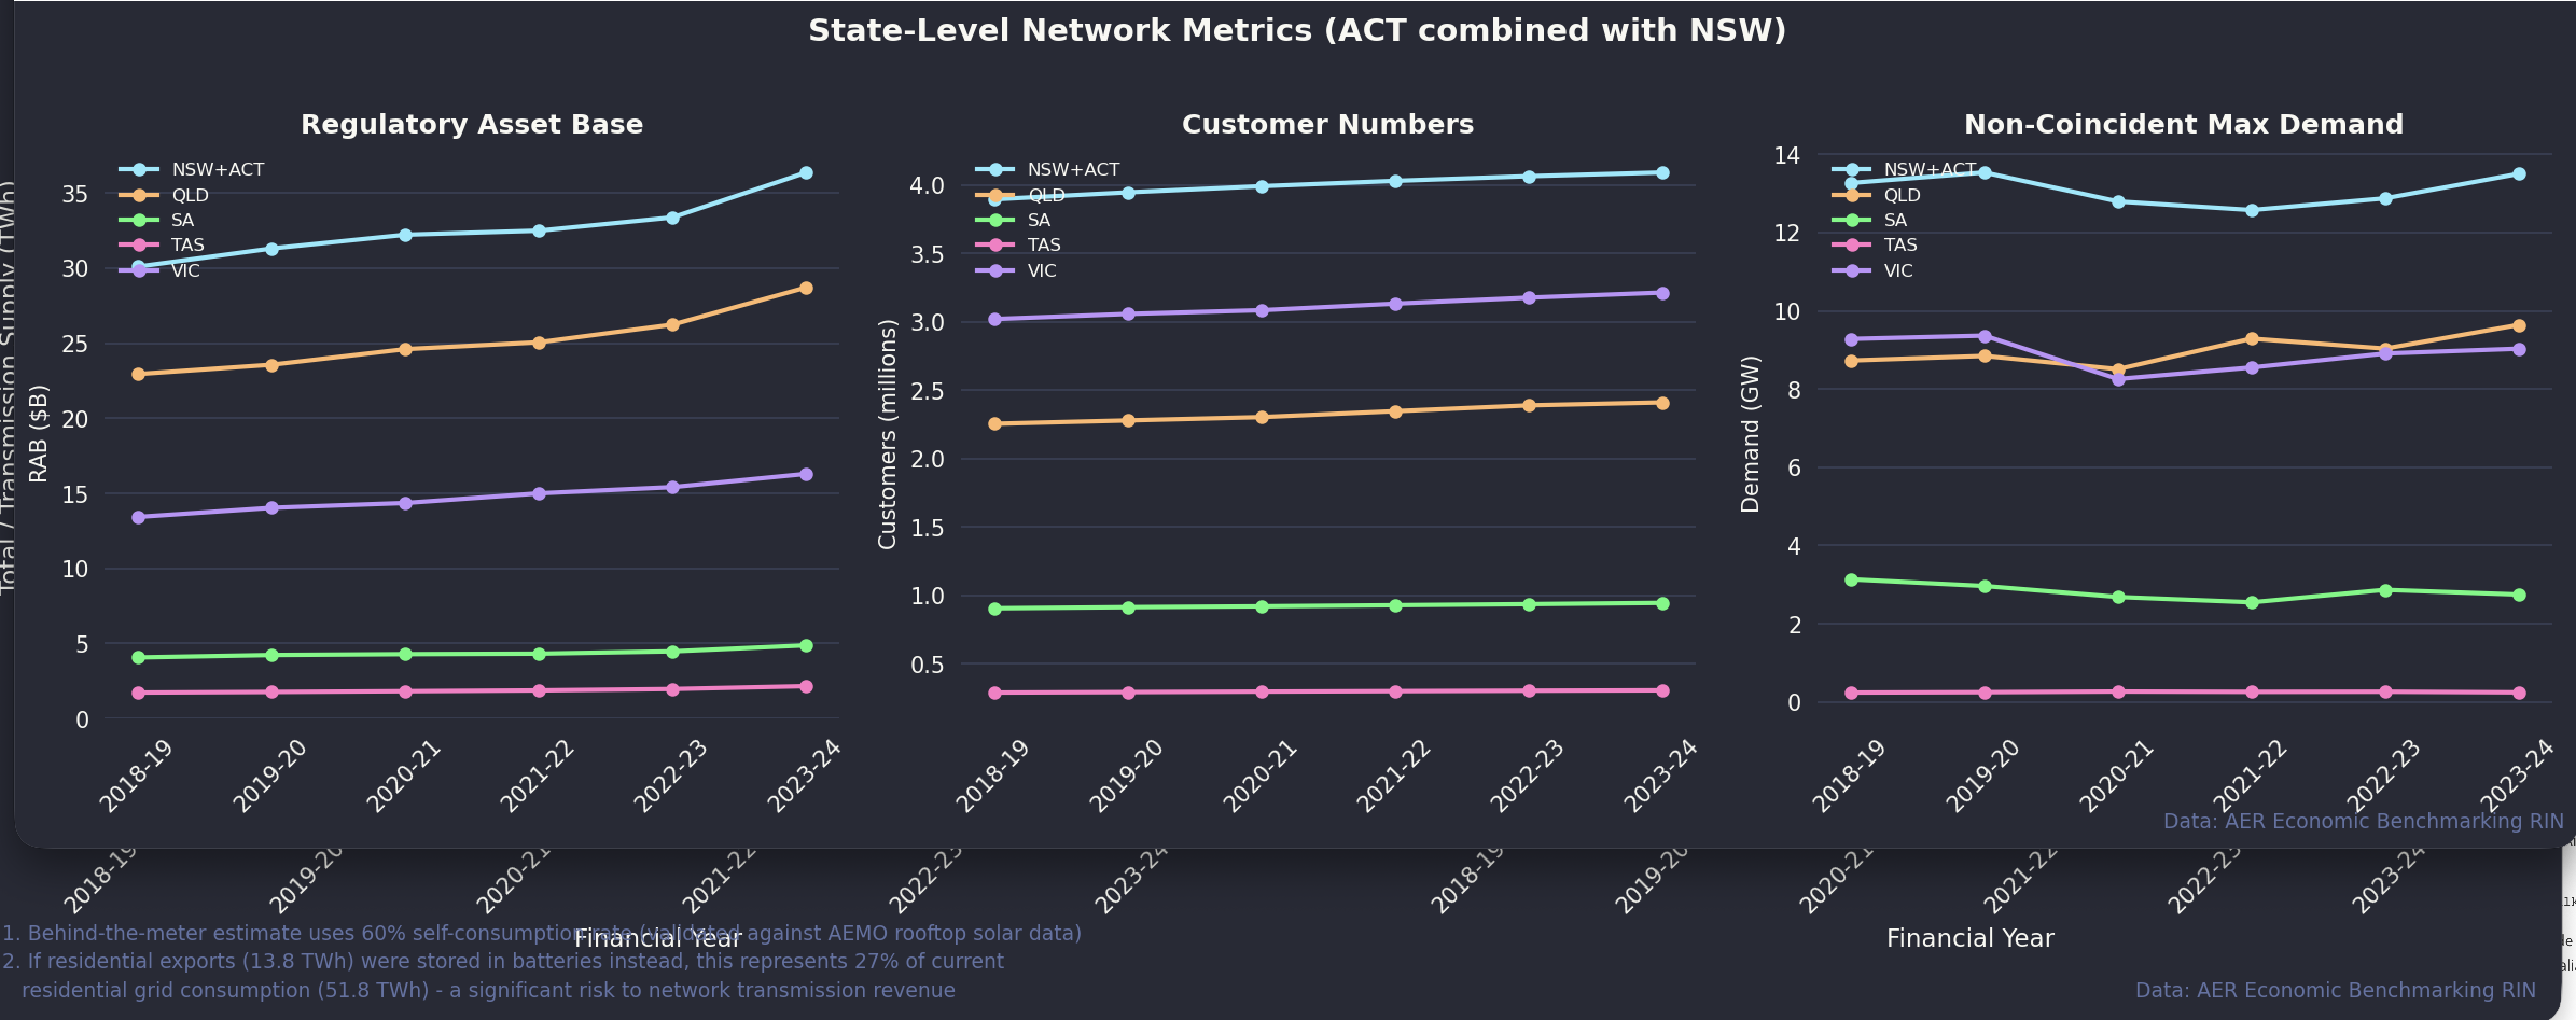
If my numbers are correct the energy supplied by transmission to so-called “last mile” networks has declined by 10% despite total customer numbers rising by 0.6 million (5.8%). Energex saw the most customer growth in absolute terms but Powercor saw 9.7% growth and Endeavour 8.3%, Evo (Canberra) was up 11% but it’s smaller. As you can see below, peak demand is essentially flat. In essence network capacity utilisation is declining.
As regulated monopolies, networks are entitled to a fixed amount of revenue each year. Hardly anyone except a network owner likes this approach. If prices are based on volumes, then as volumes fall and revenue stays constant, prices have to rise. Networks also find it hard to influence consumer behaviour. As Bruce Mountain so famously said, the regulator is the customer of the network - consumers are customers of the retailer.
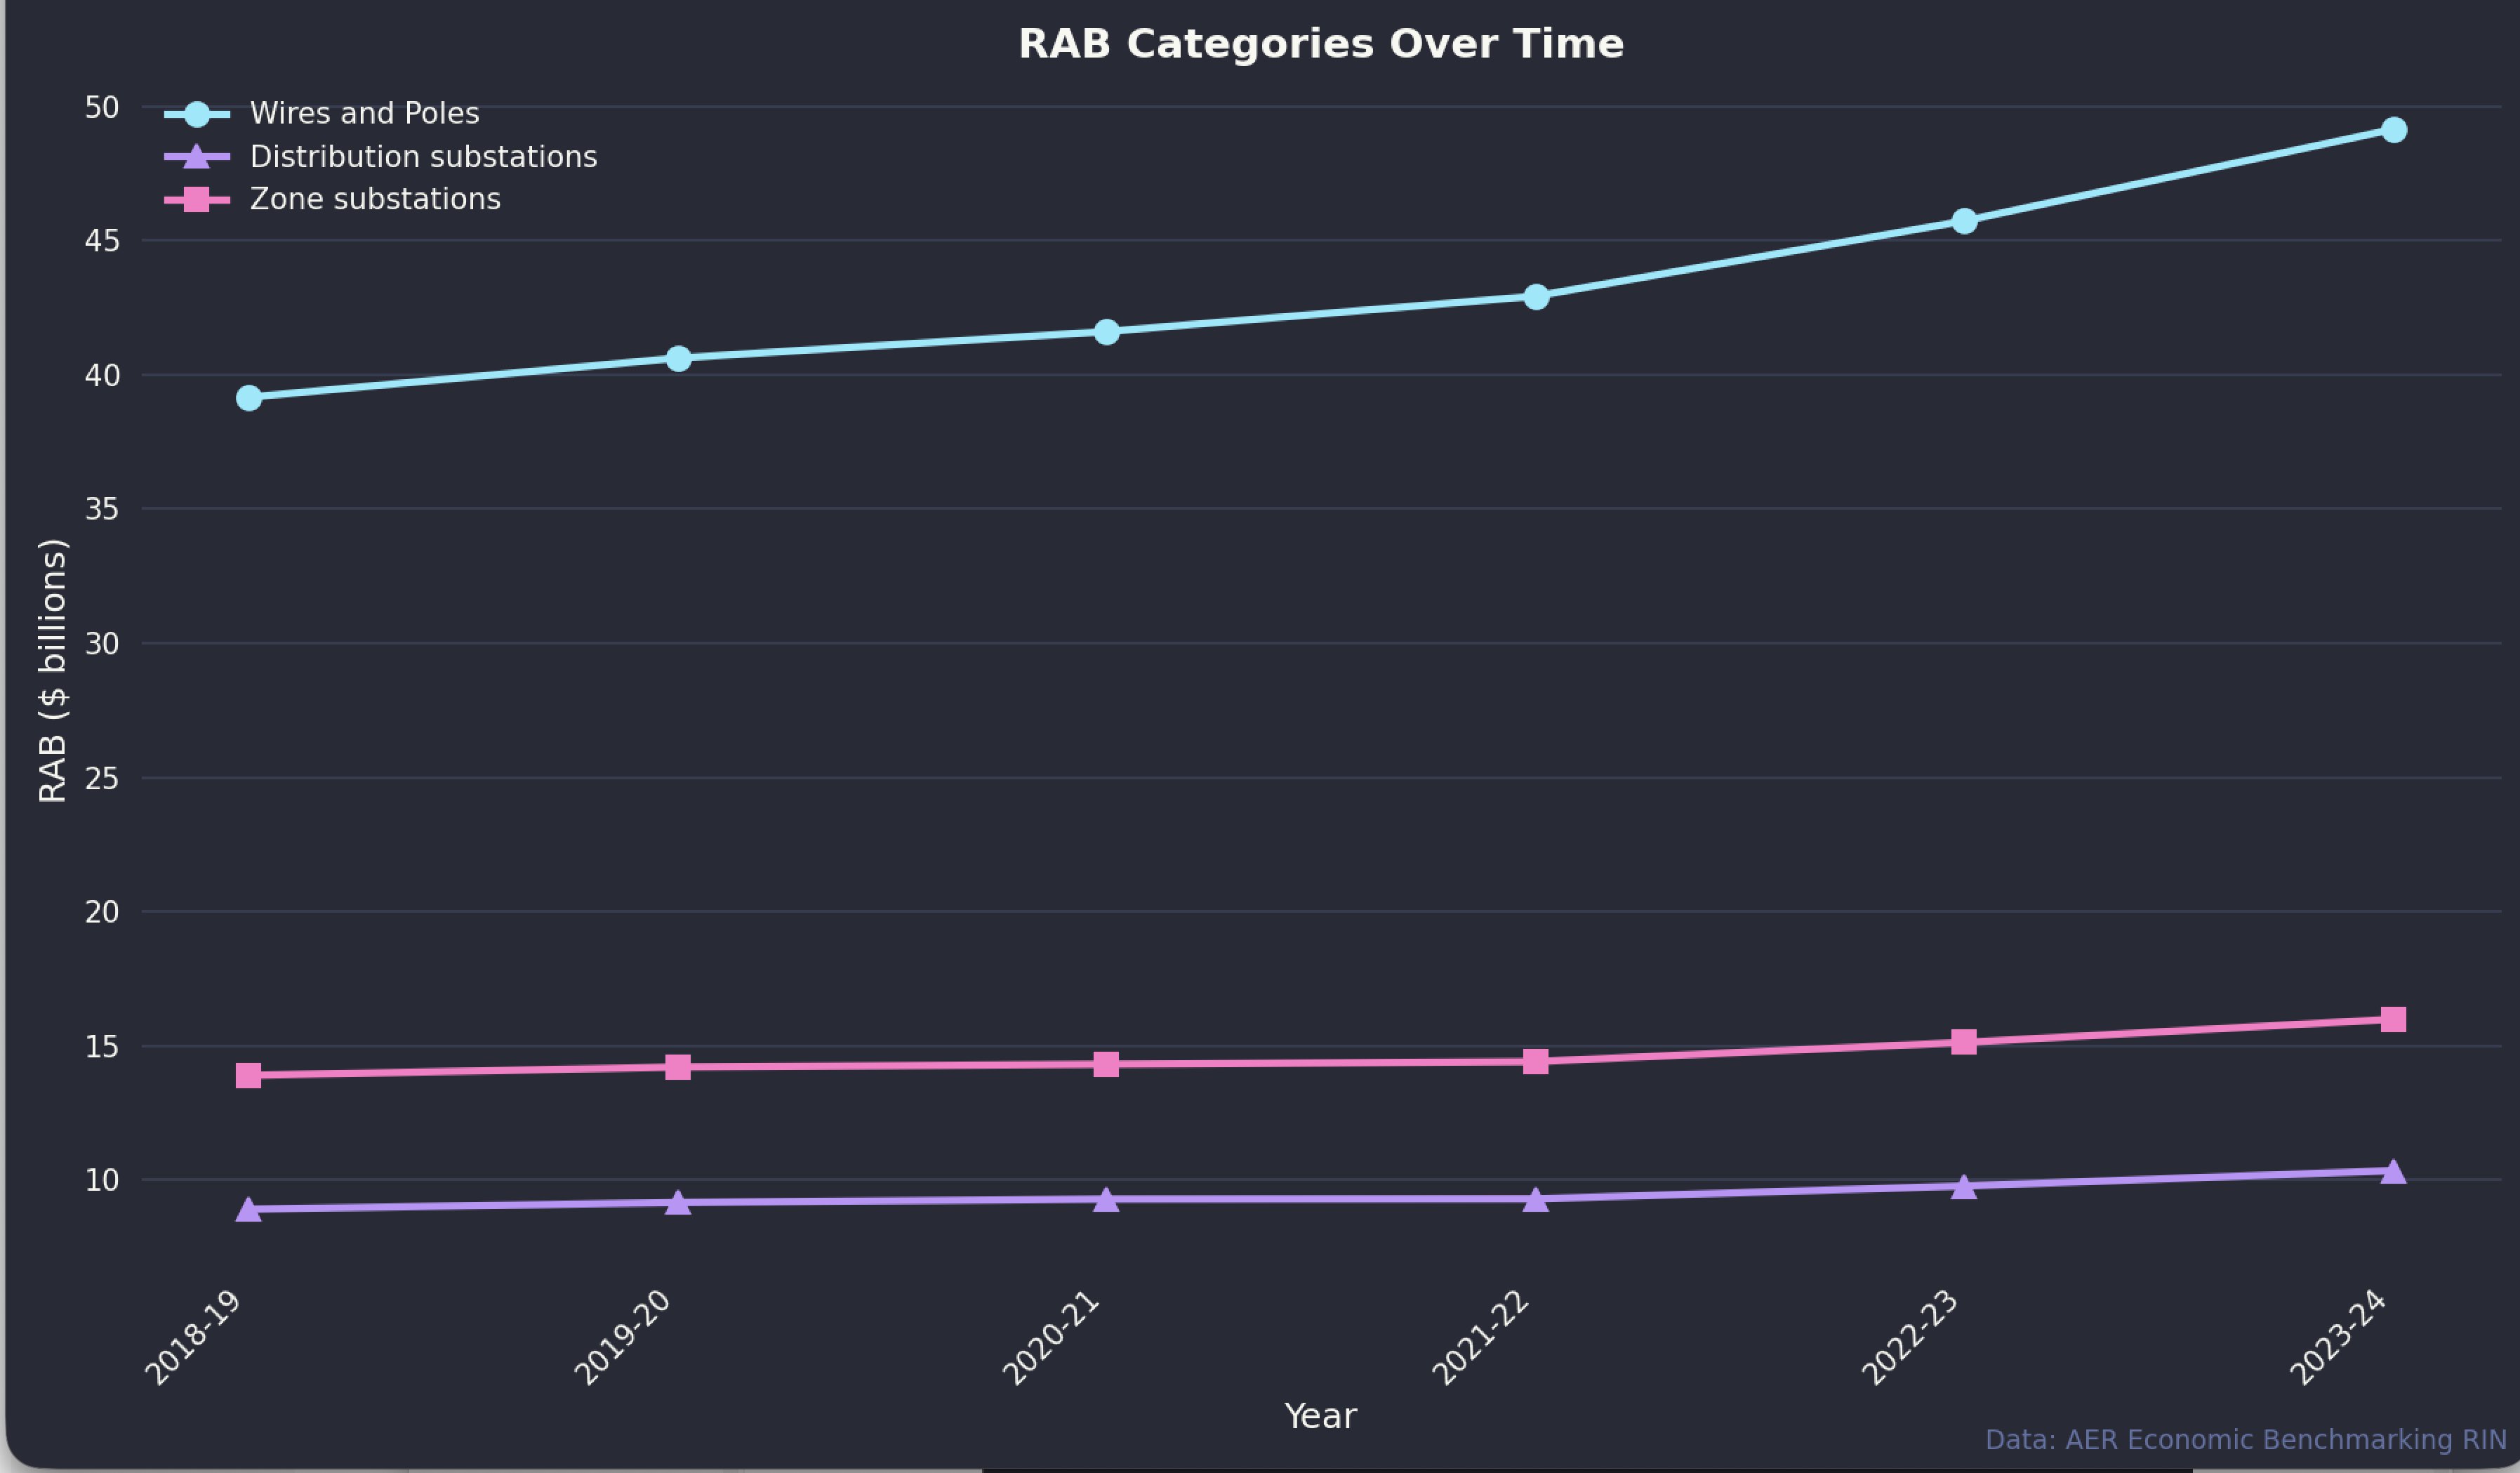
As the chart below shows, the vast majority of the network asset base is made up of overhead and underground wires and poles. The real value of wires and poles (the chart shows nominal value) grows with population and is driven by dwelling density. Because Australians still want space, there is more growth in suburbs and regions where detached houses remain the norm.
The whole electricity system is full of duplication. Two entire customer care systems are needed, one for the retailer and another for the network. The network’s commercial interests are generally not related to retailer interests. Ring fencing, embedded networks, community batteries, EV charging ownership etc are all issues.
In general as I’ve pointed out several times and as originally pointed out by the inestimable Merv Davies, the value of a network is largely fixed and driven by the capital cost of installing the network. Once the wires and poles are built whether you have a fixed cost, or a usage cost has little or no impact on investment. This means that how you charge households is basically a policy decision. Do you want customers to export? Do you want them to self-consume? Do you want them to share? I strongly believe that we want consumers to use lots of electricity via electrification, to convert to electric cars, to get rid of gas. We want consumers to be as self sufficient as possible. Overhead lines are highly vulnerable to storms and fires, indeed can cause fires. Self reliance should be encouraged.
There is basically plenty of capacity, and on average inwards throughput through the wires is declining. In this note I also observe that home batteries will also reduce exports or at least, depending on the relative growth of rooftop solar and household batteries, the growth of exports. So even if networks switched to export charging it’s unlikely to be effective.
So much of what follows is a collection of charts with not too much commentary. People can draw their own conclusions, and I welcome corrections if anyone spots errors.
The most interesting, to me, chart I produced from the data is:
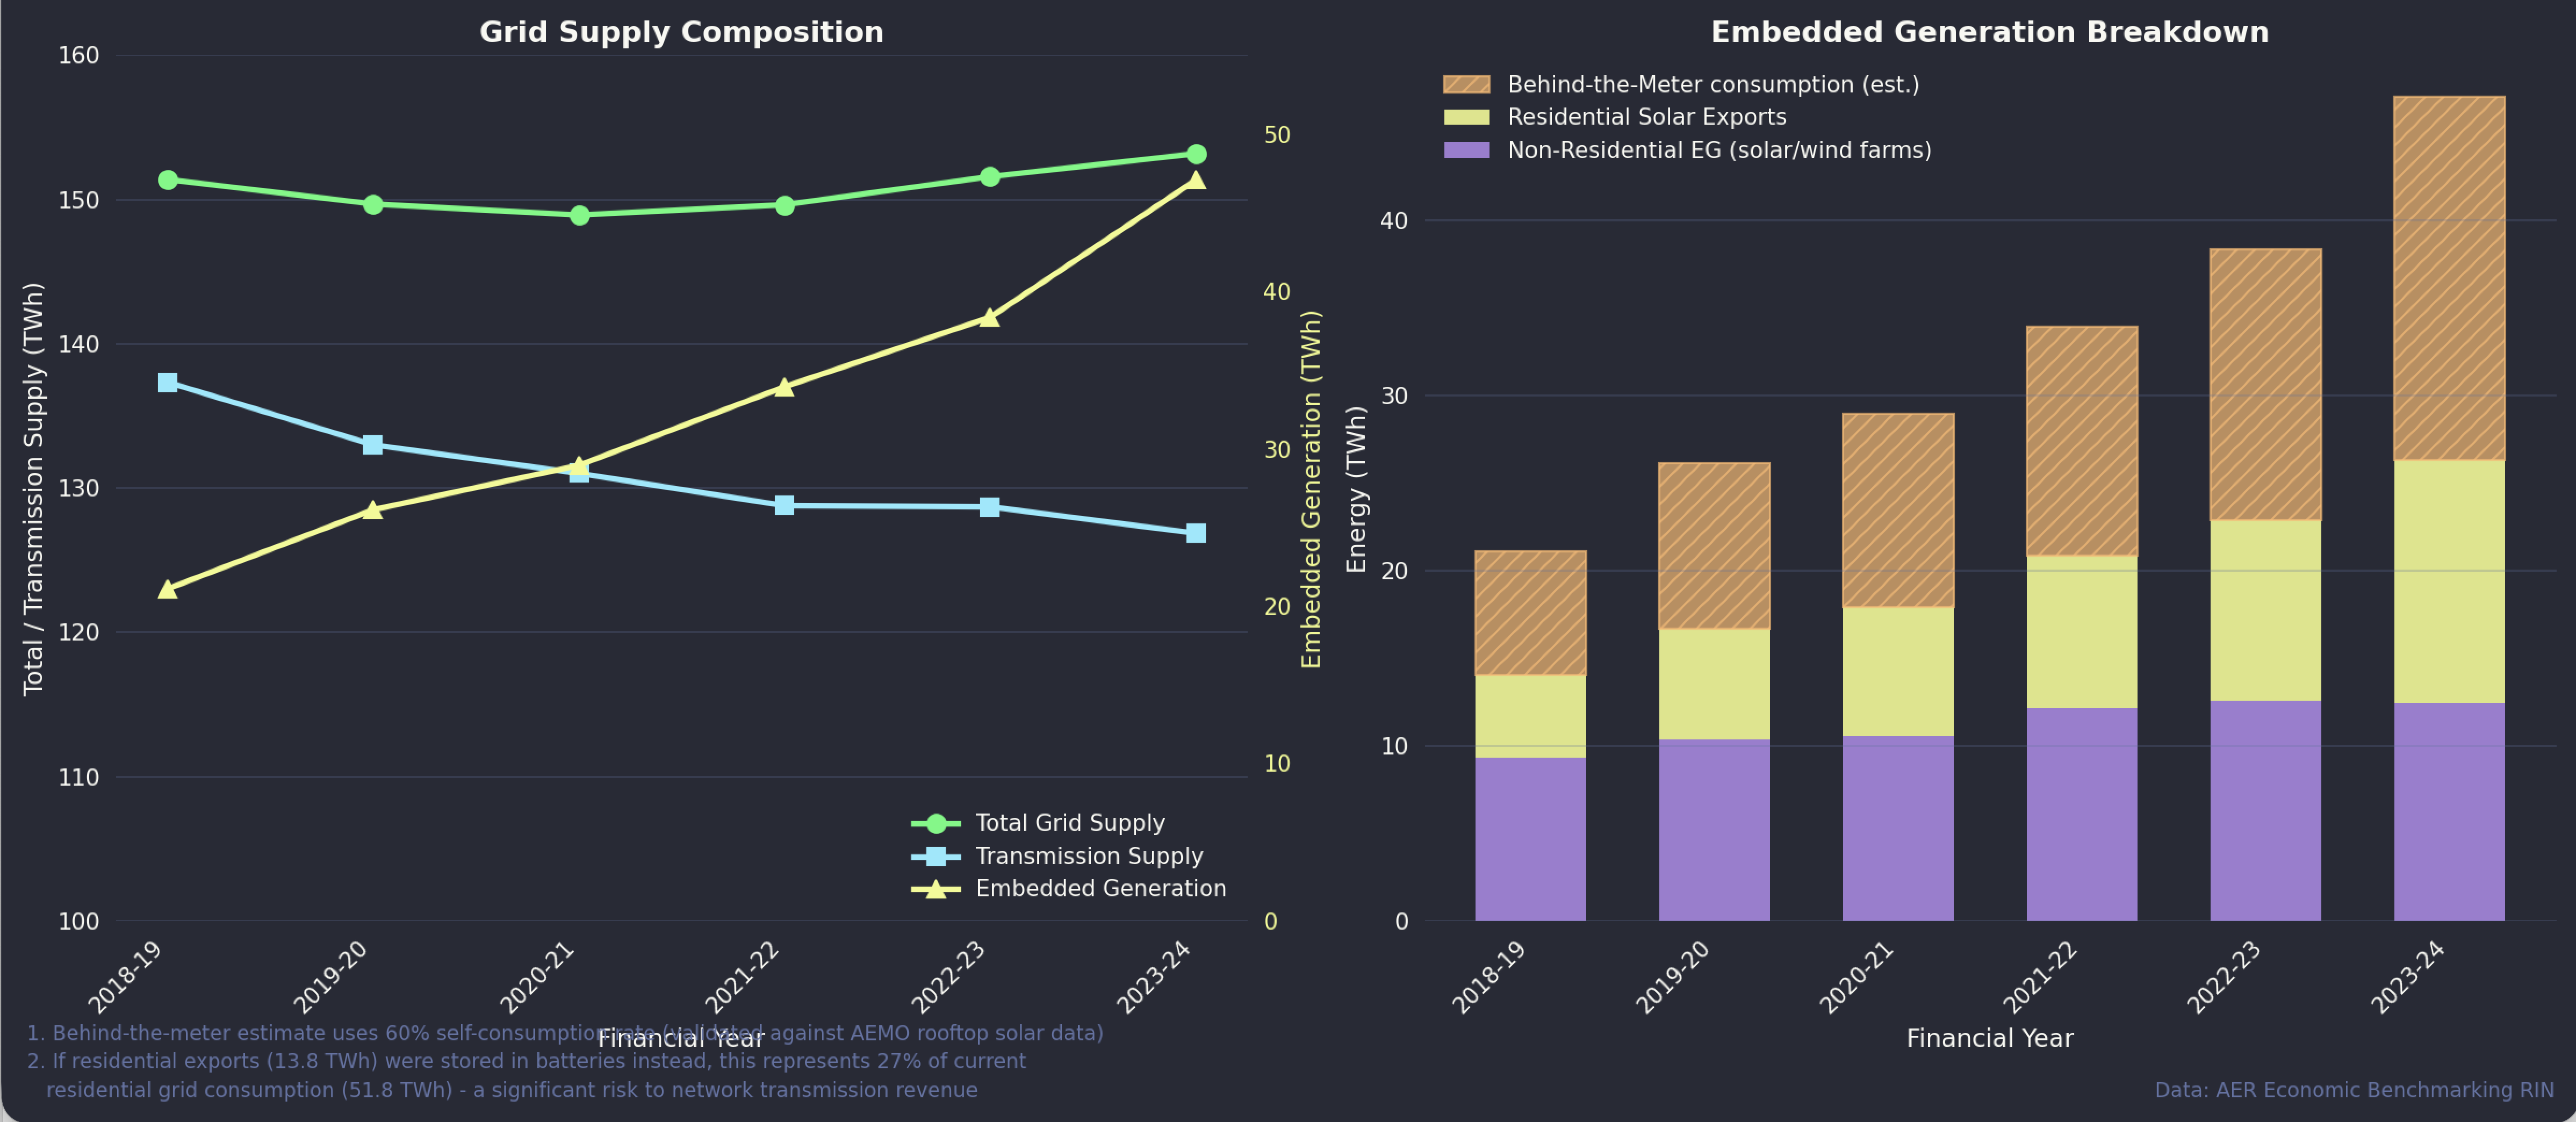
Note that “transmission supply” is energy supplied to the networks from outside the network. It’s more or less, but maybe not completely “operational supply”. As you can see, and on the assumption the numbers are correct, that supply has fallen almost 14 TWh or about 10% since FY19. The RIN statements include data for embedded generation and the residential side of that is obviously rooftop solar. However the RIN statements only report the total rooftop exports. To estimate the behind the meter consumption I took AEMO’s rooftop production estimates reported half-hourly aggregated them up and then subtracted exports. This produces an estimate of about 60% of rooftop solar is consumed behind the meter. It’s a roughly similar ratio for each year. 60% is more than some other estimates I’ve seen but AEMO’s data is accepted.
One might expect exports or at least the growth in exports to decline as rooftop batteries get going, essentially this will result in less “transmission supply”.
So either networks will have to find new revenue sources or accept a reduction in RAB. Right now they are jumping up and down for more fixed charges, but that is essentially just slicing things in a different way.
Customer numbers and RAB grow
That decline in grid supply has happened despite steady growth in customer numbers.
And the reality of it can be seen in total revenue which is flat in nominal terms, although an optimist would point to the post FY21 growth. Lower or higher interest rates drive revenue as does inflation. 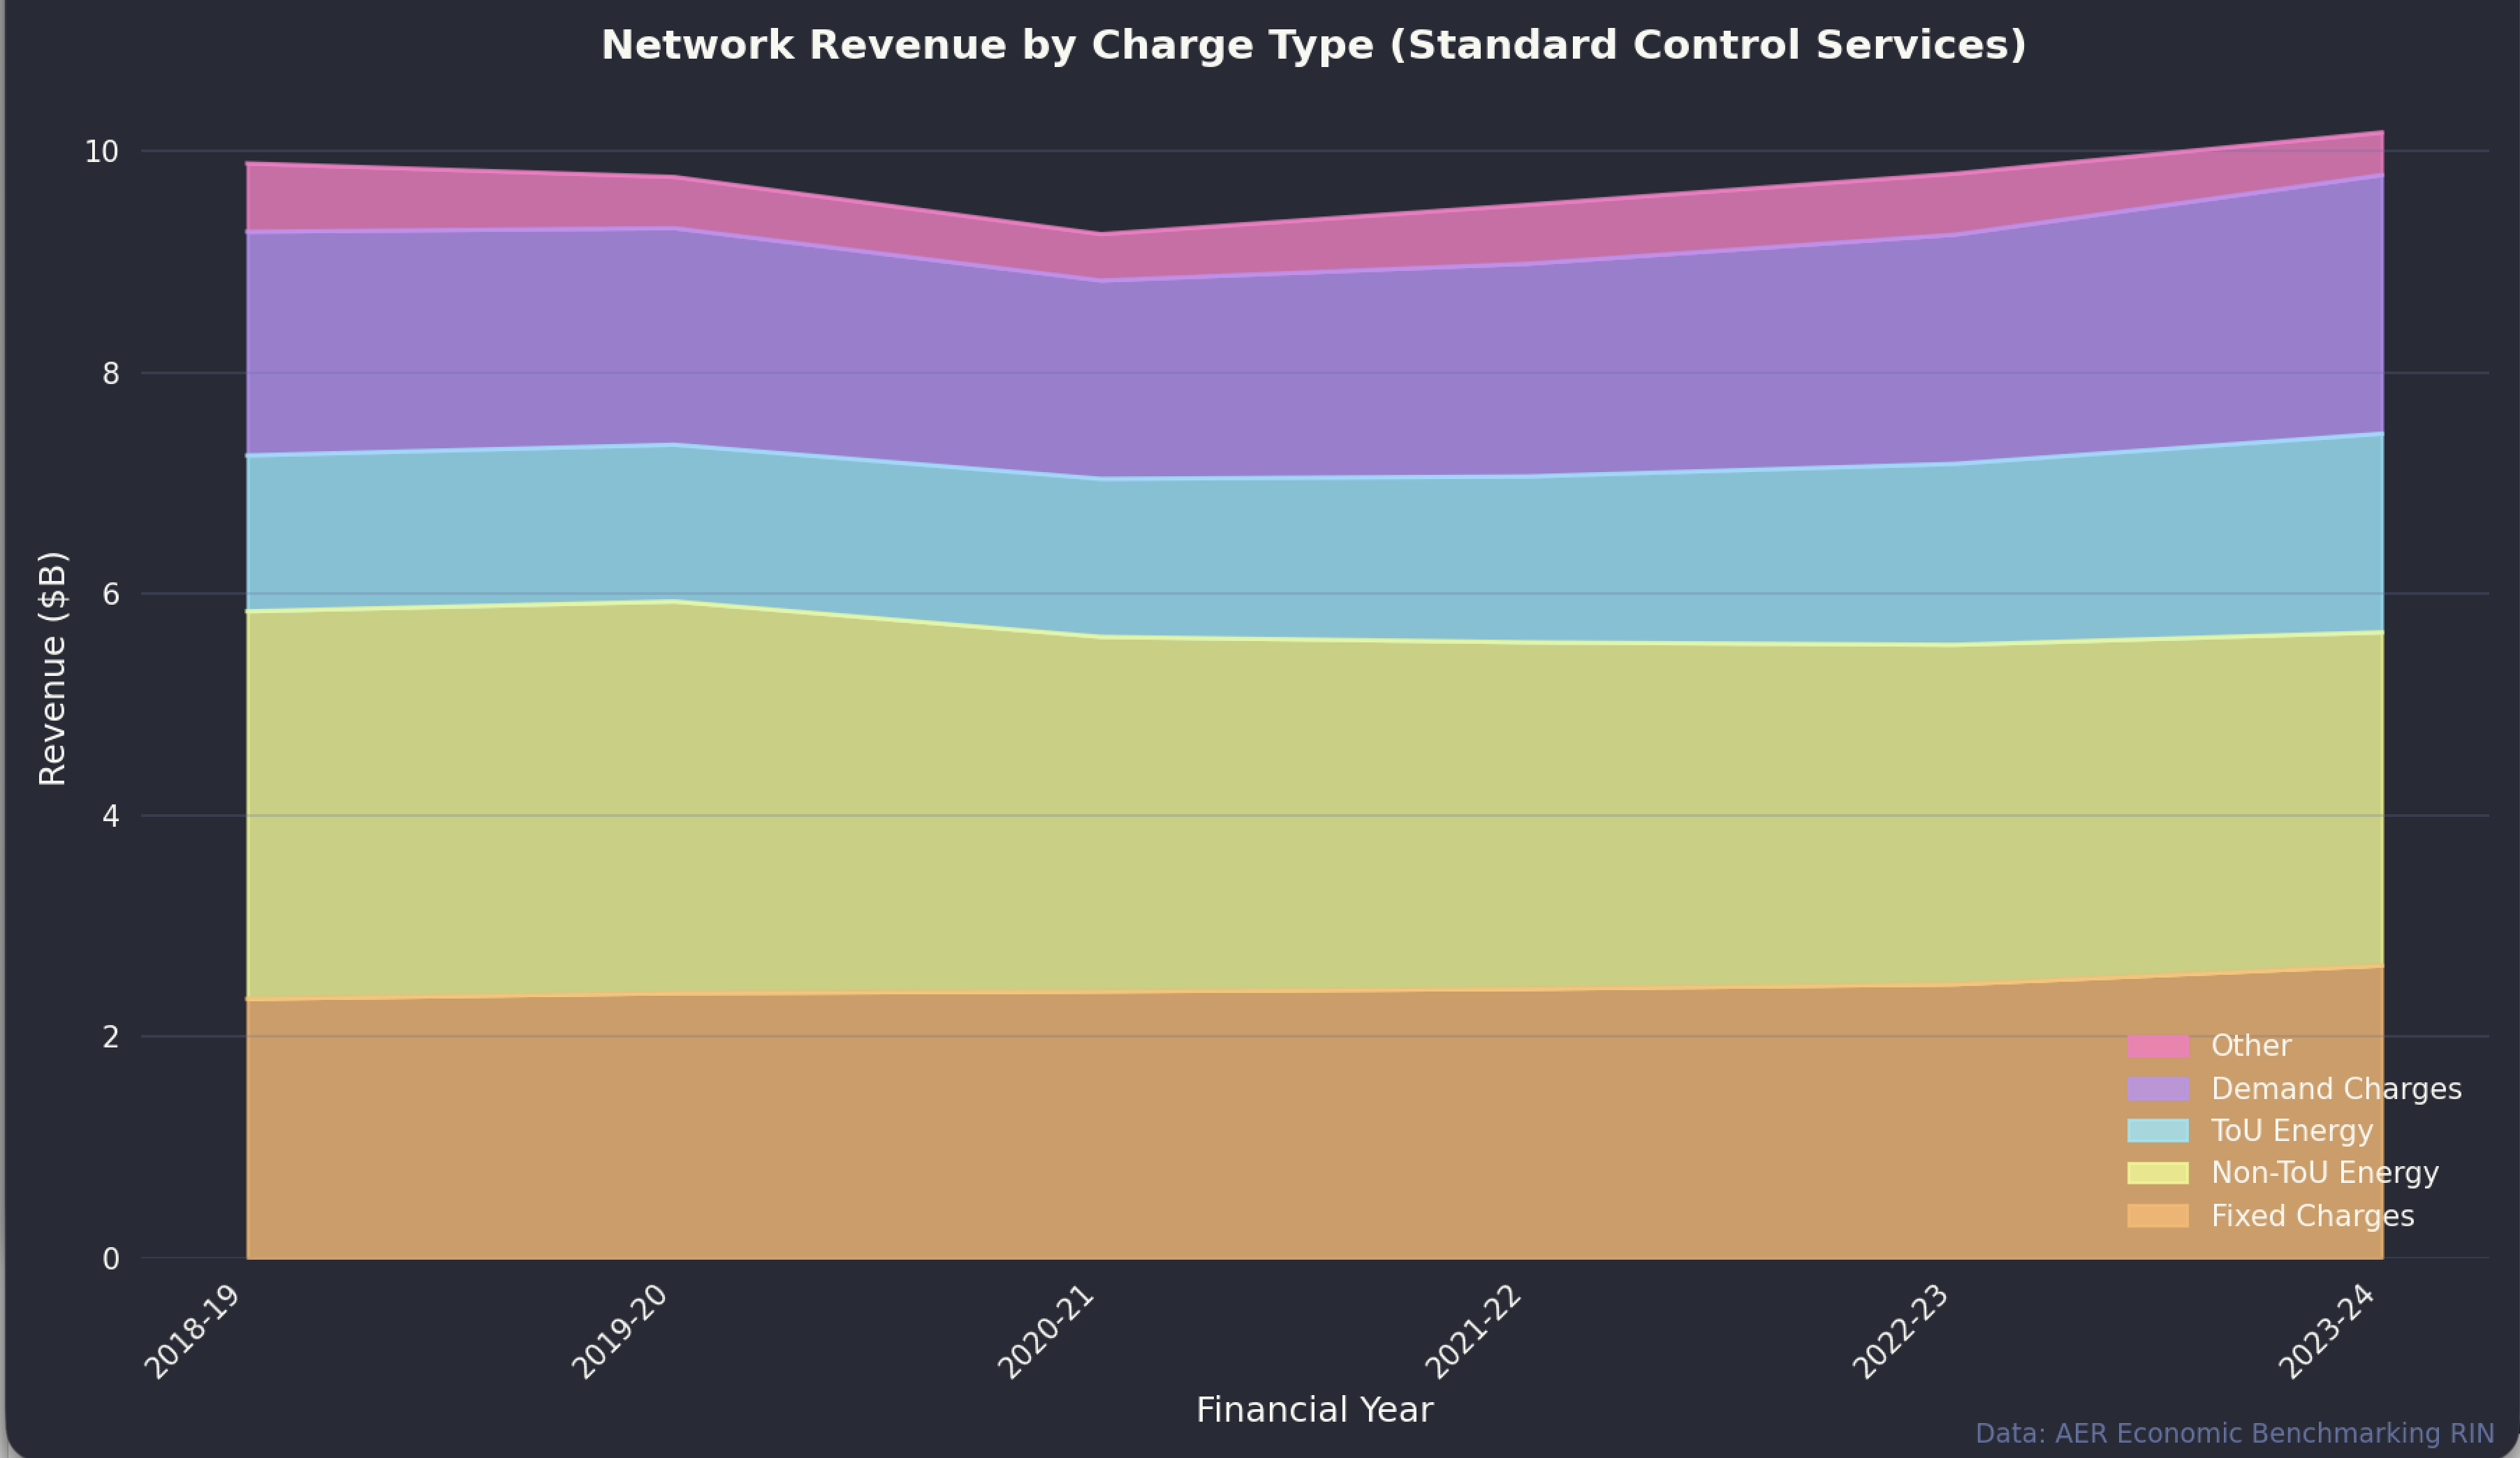
Broadly similar trends can be seen in most States although each is dependent on the timing of regulatory reviews. 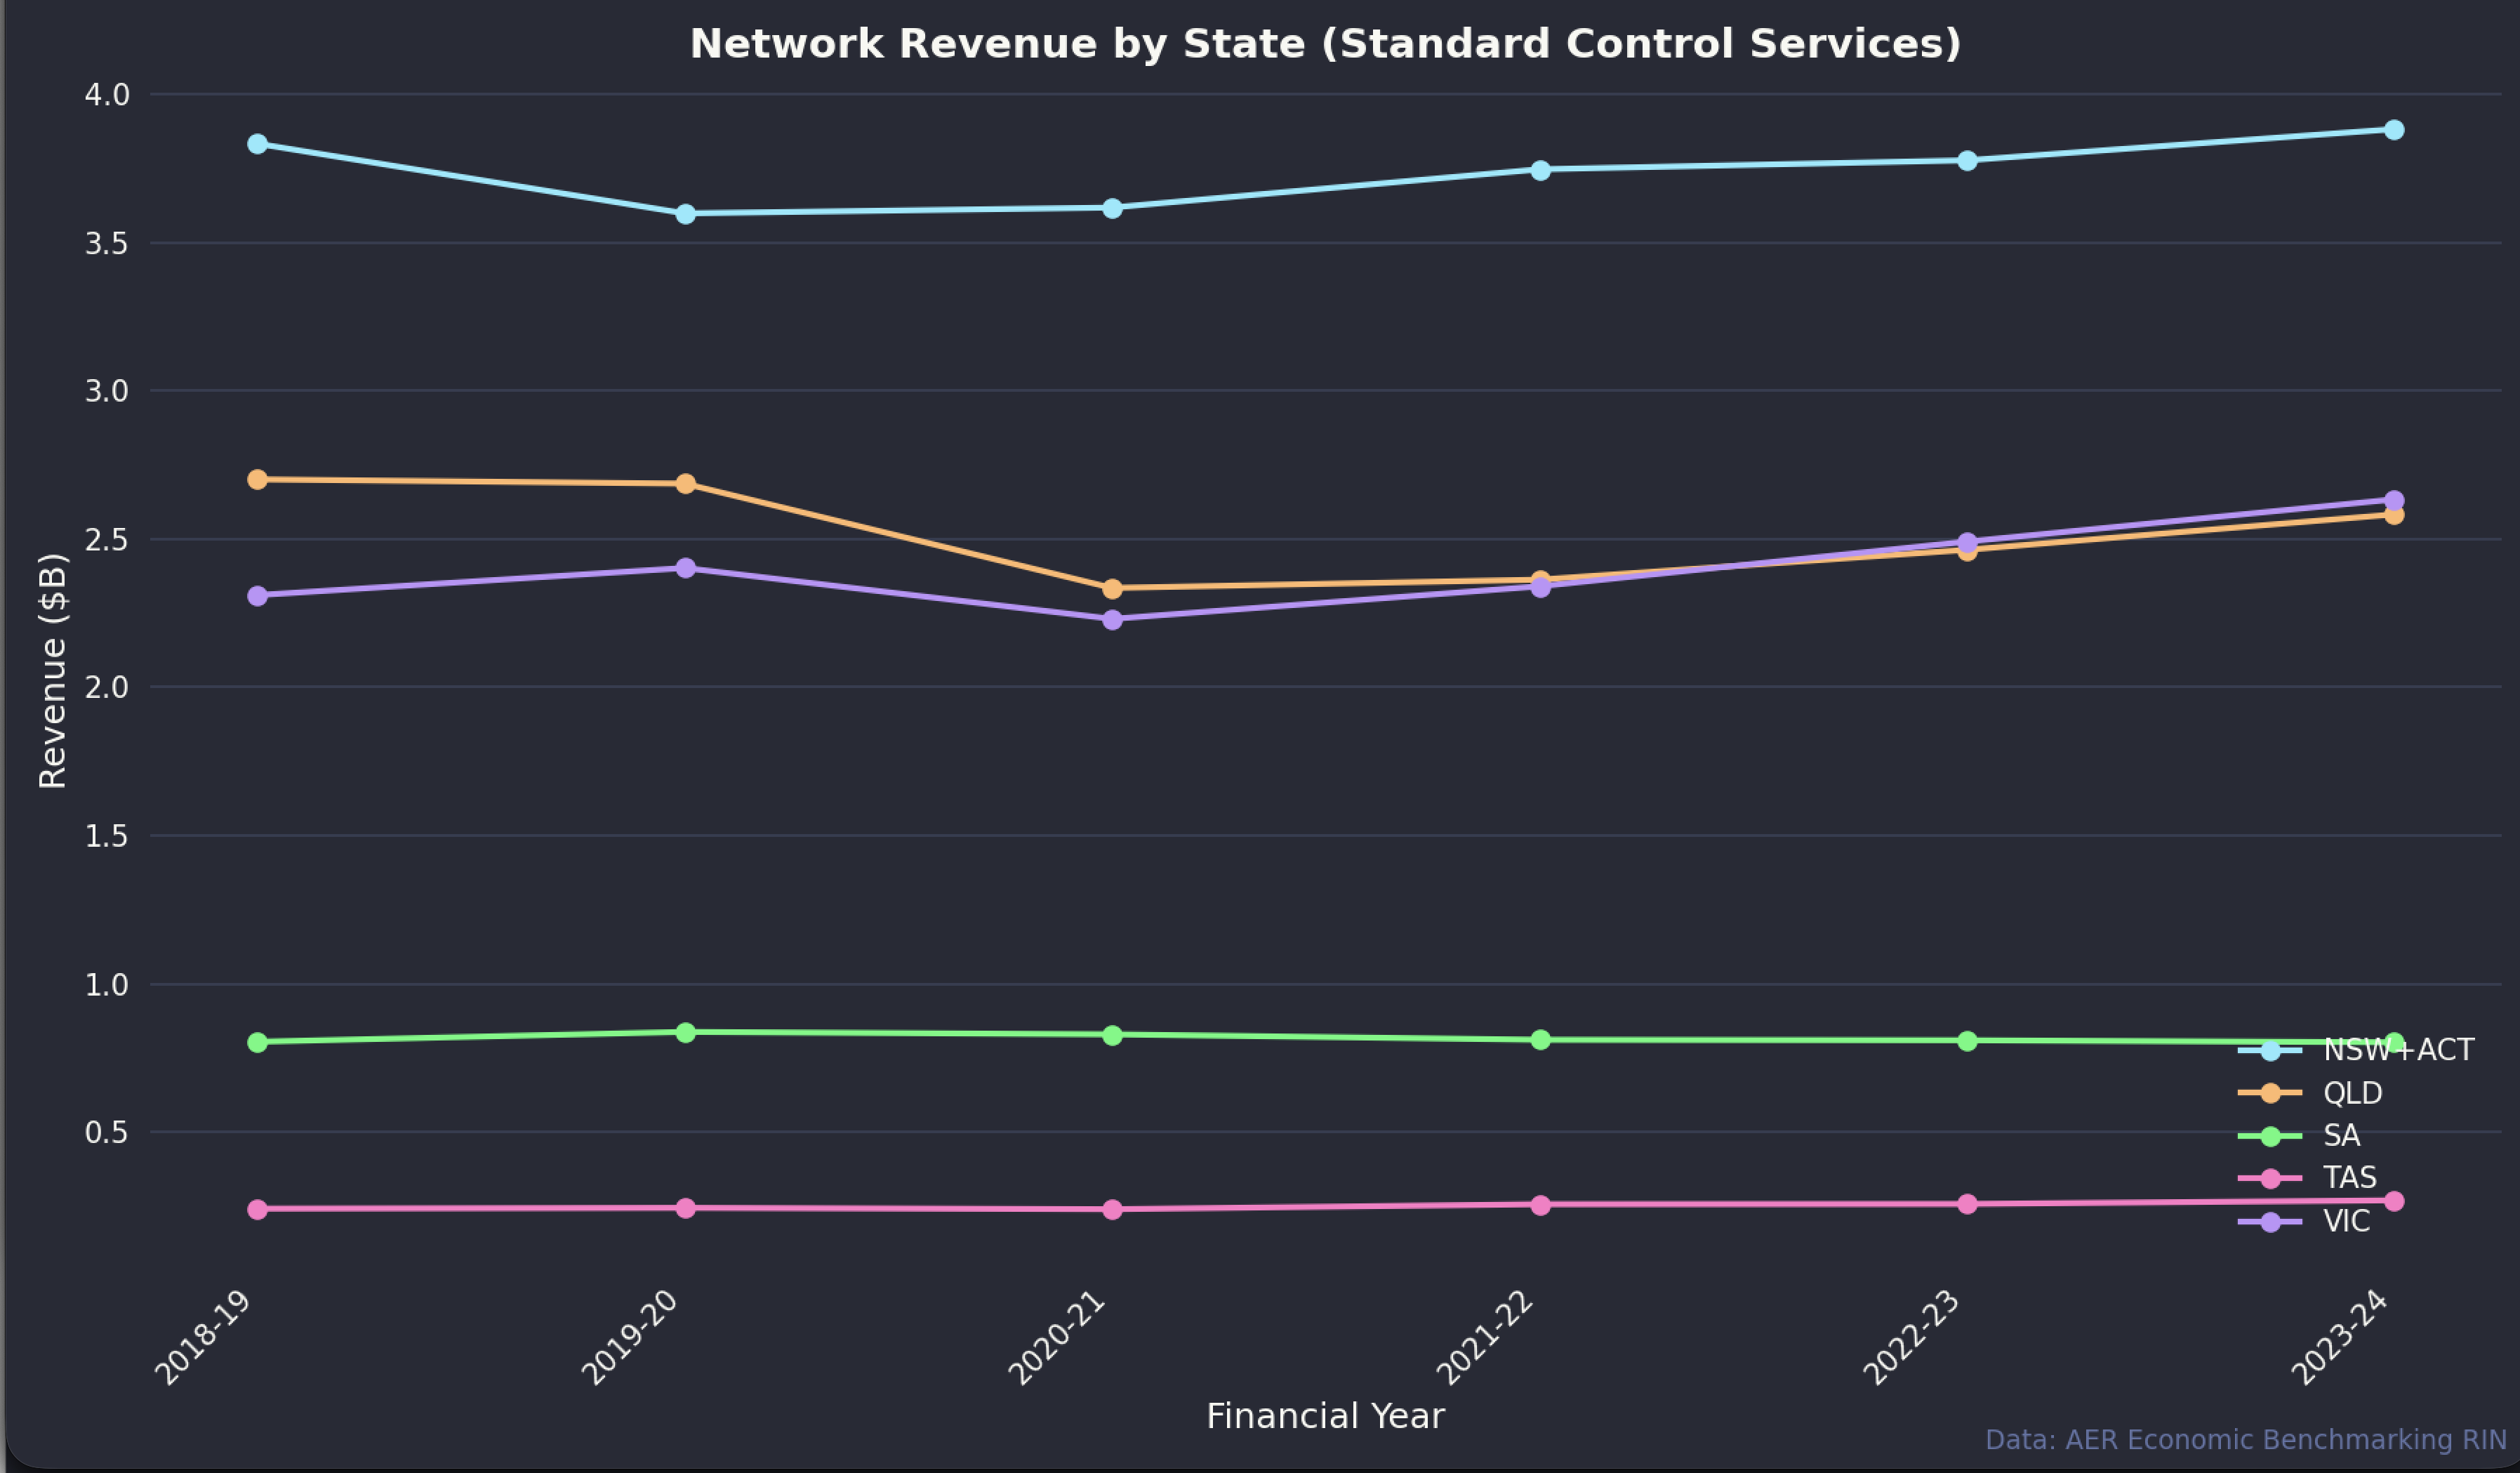
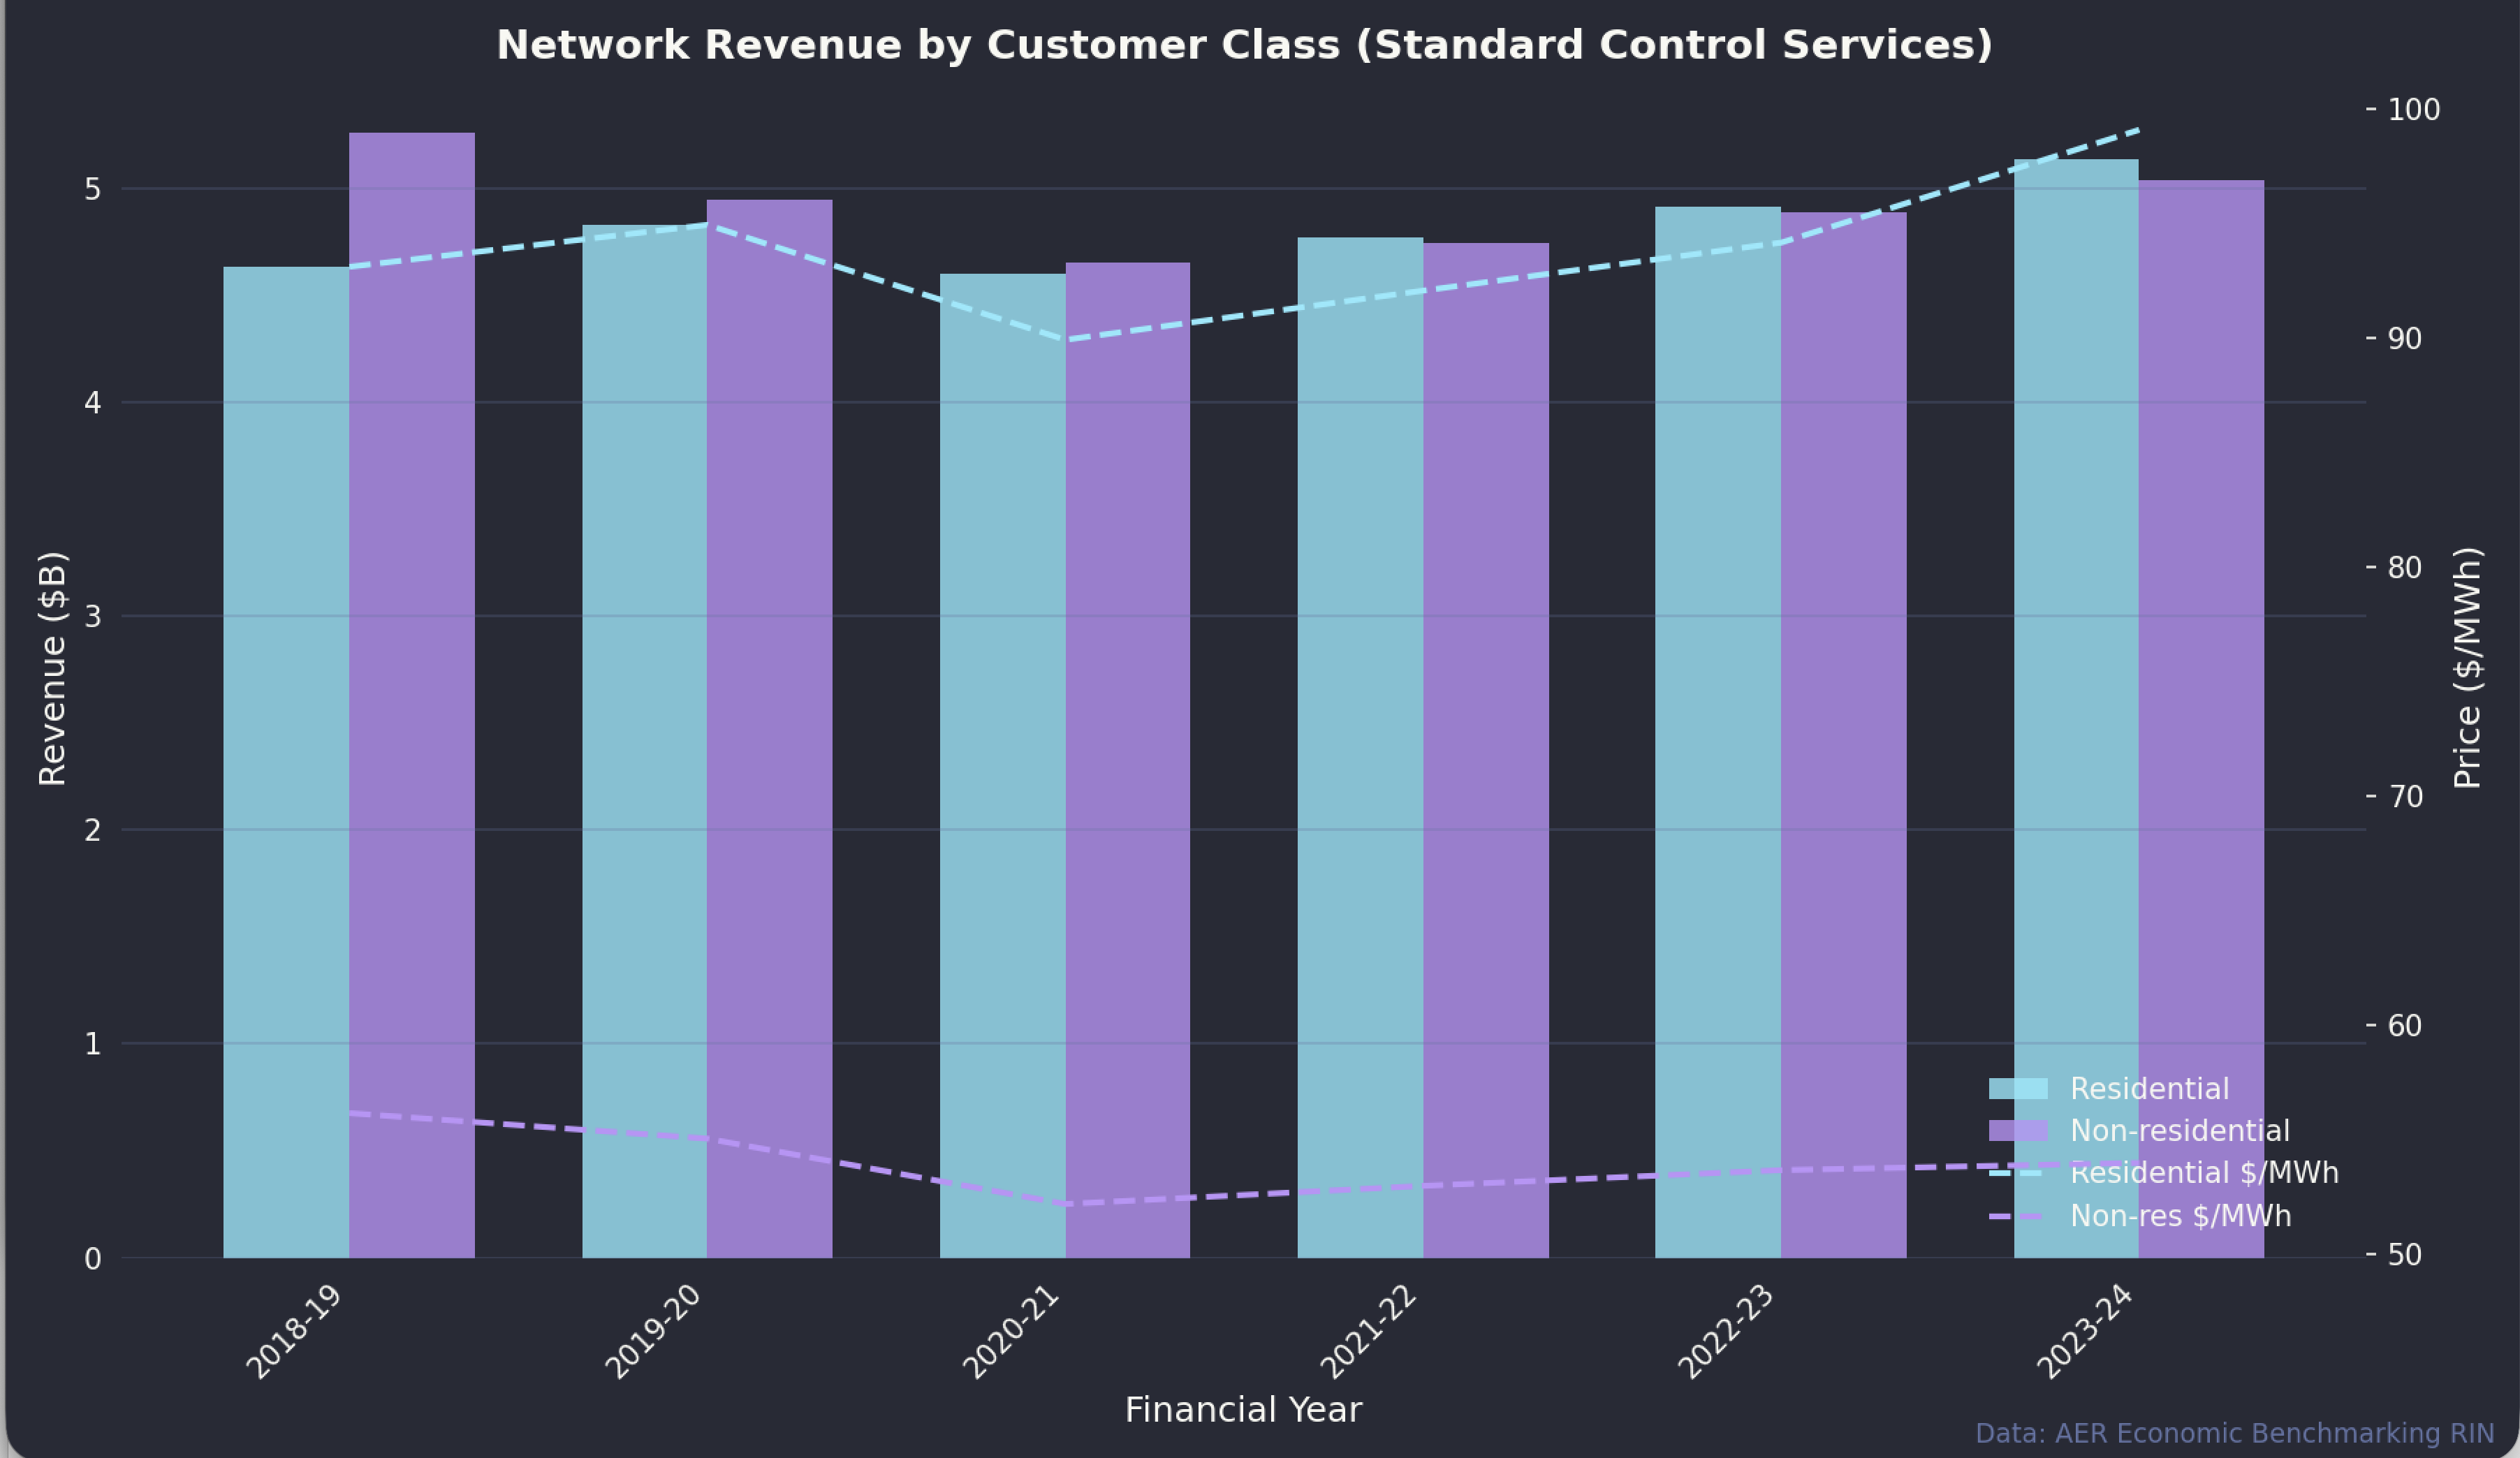
Non-residential revenue is more important than I would have thought, lots of volume at half the price.
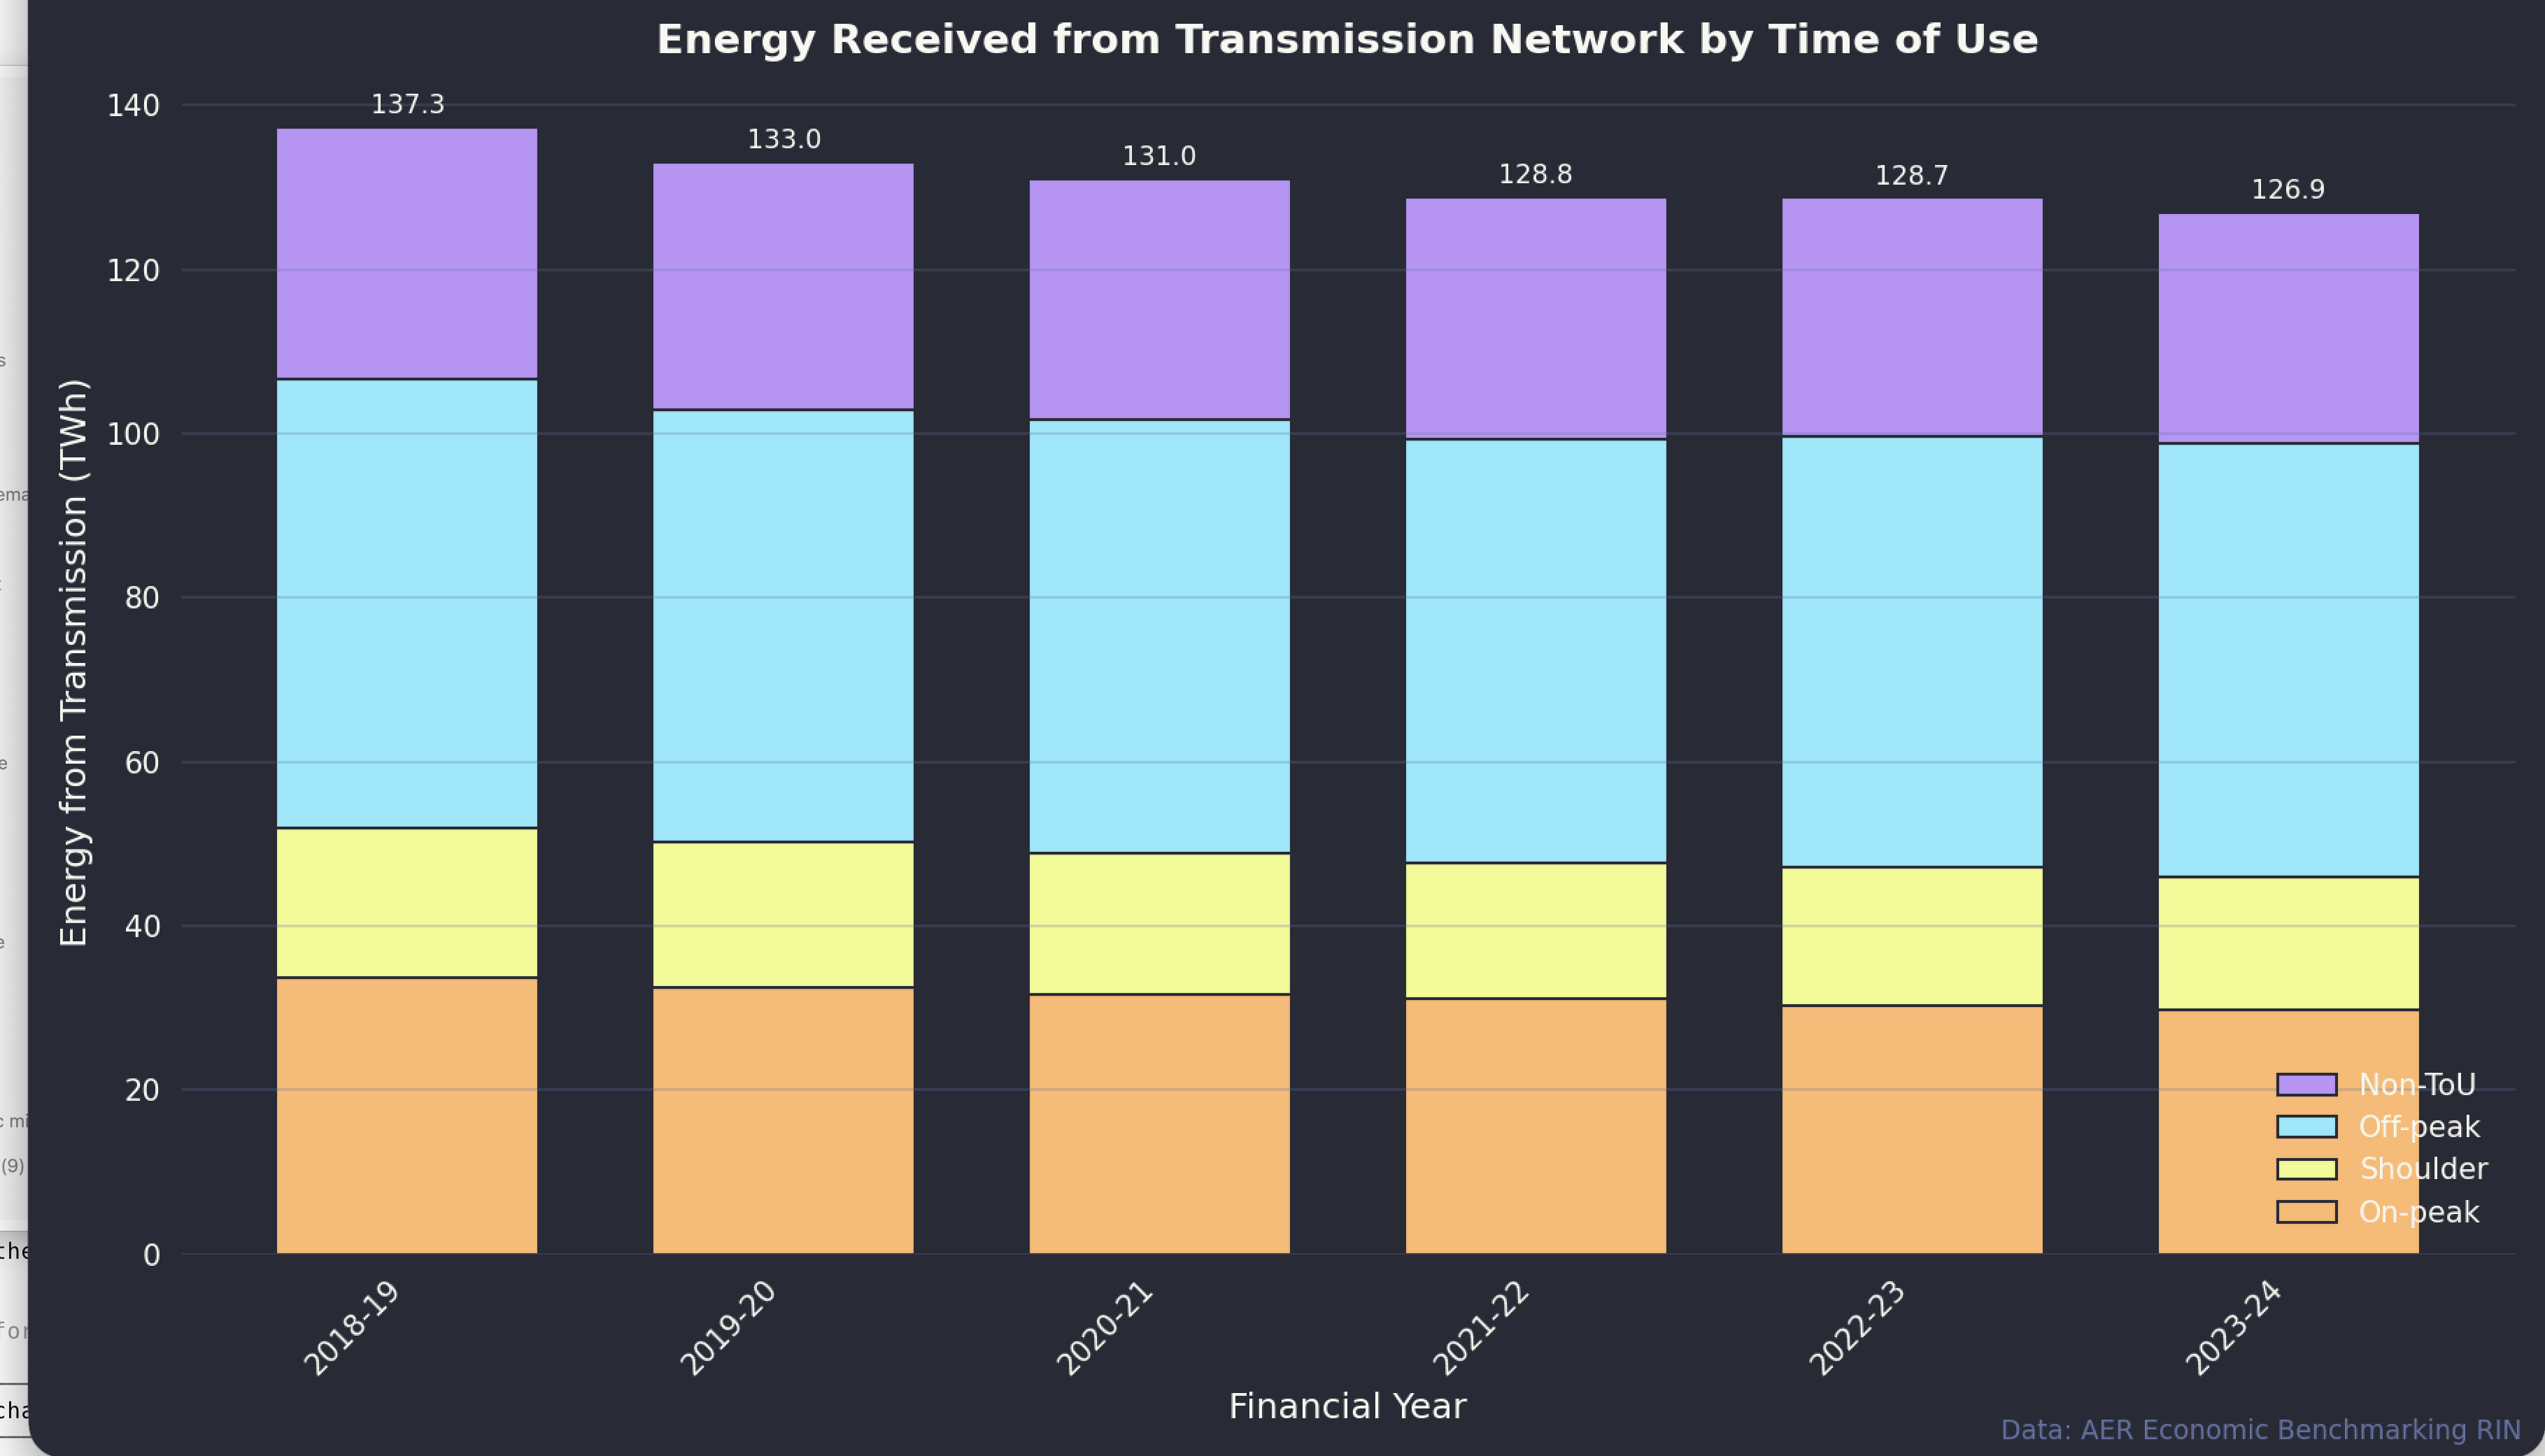
Volumes are well split and Non-TOU appears to be in decline:
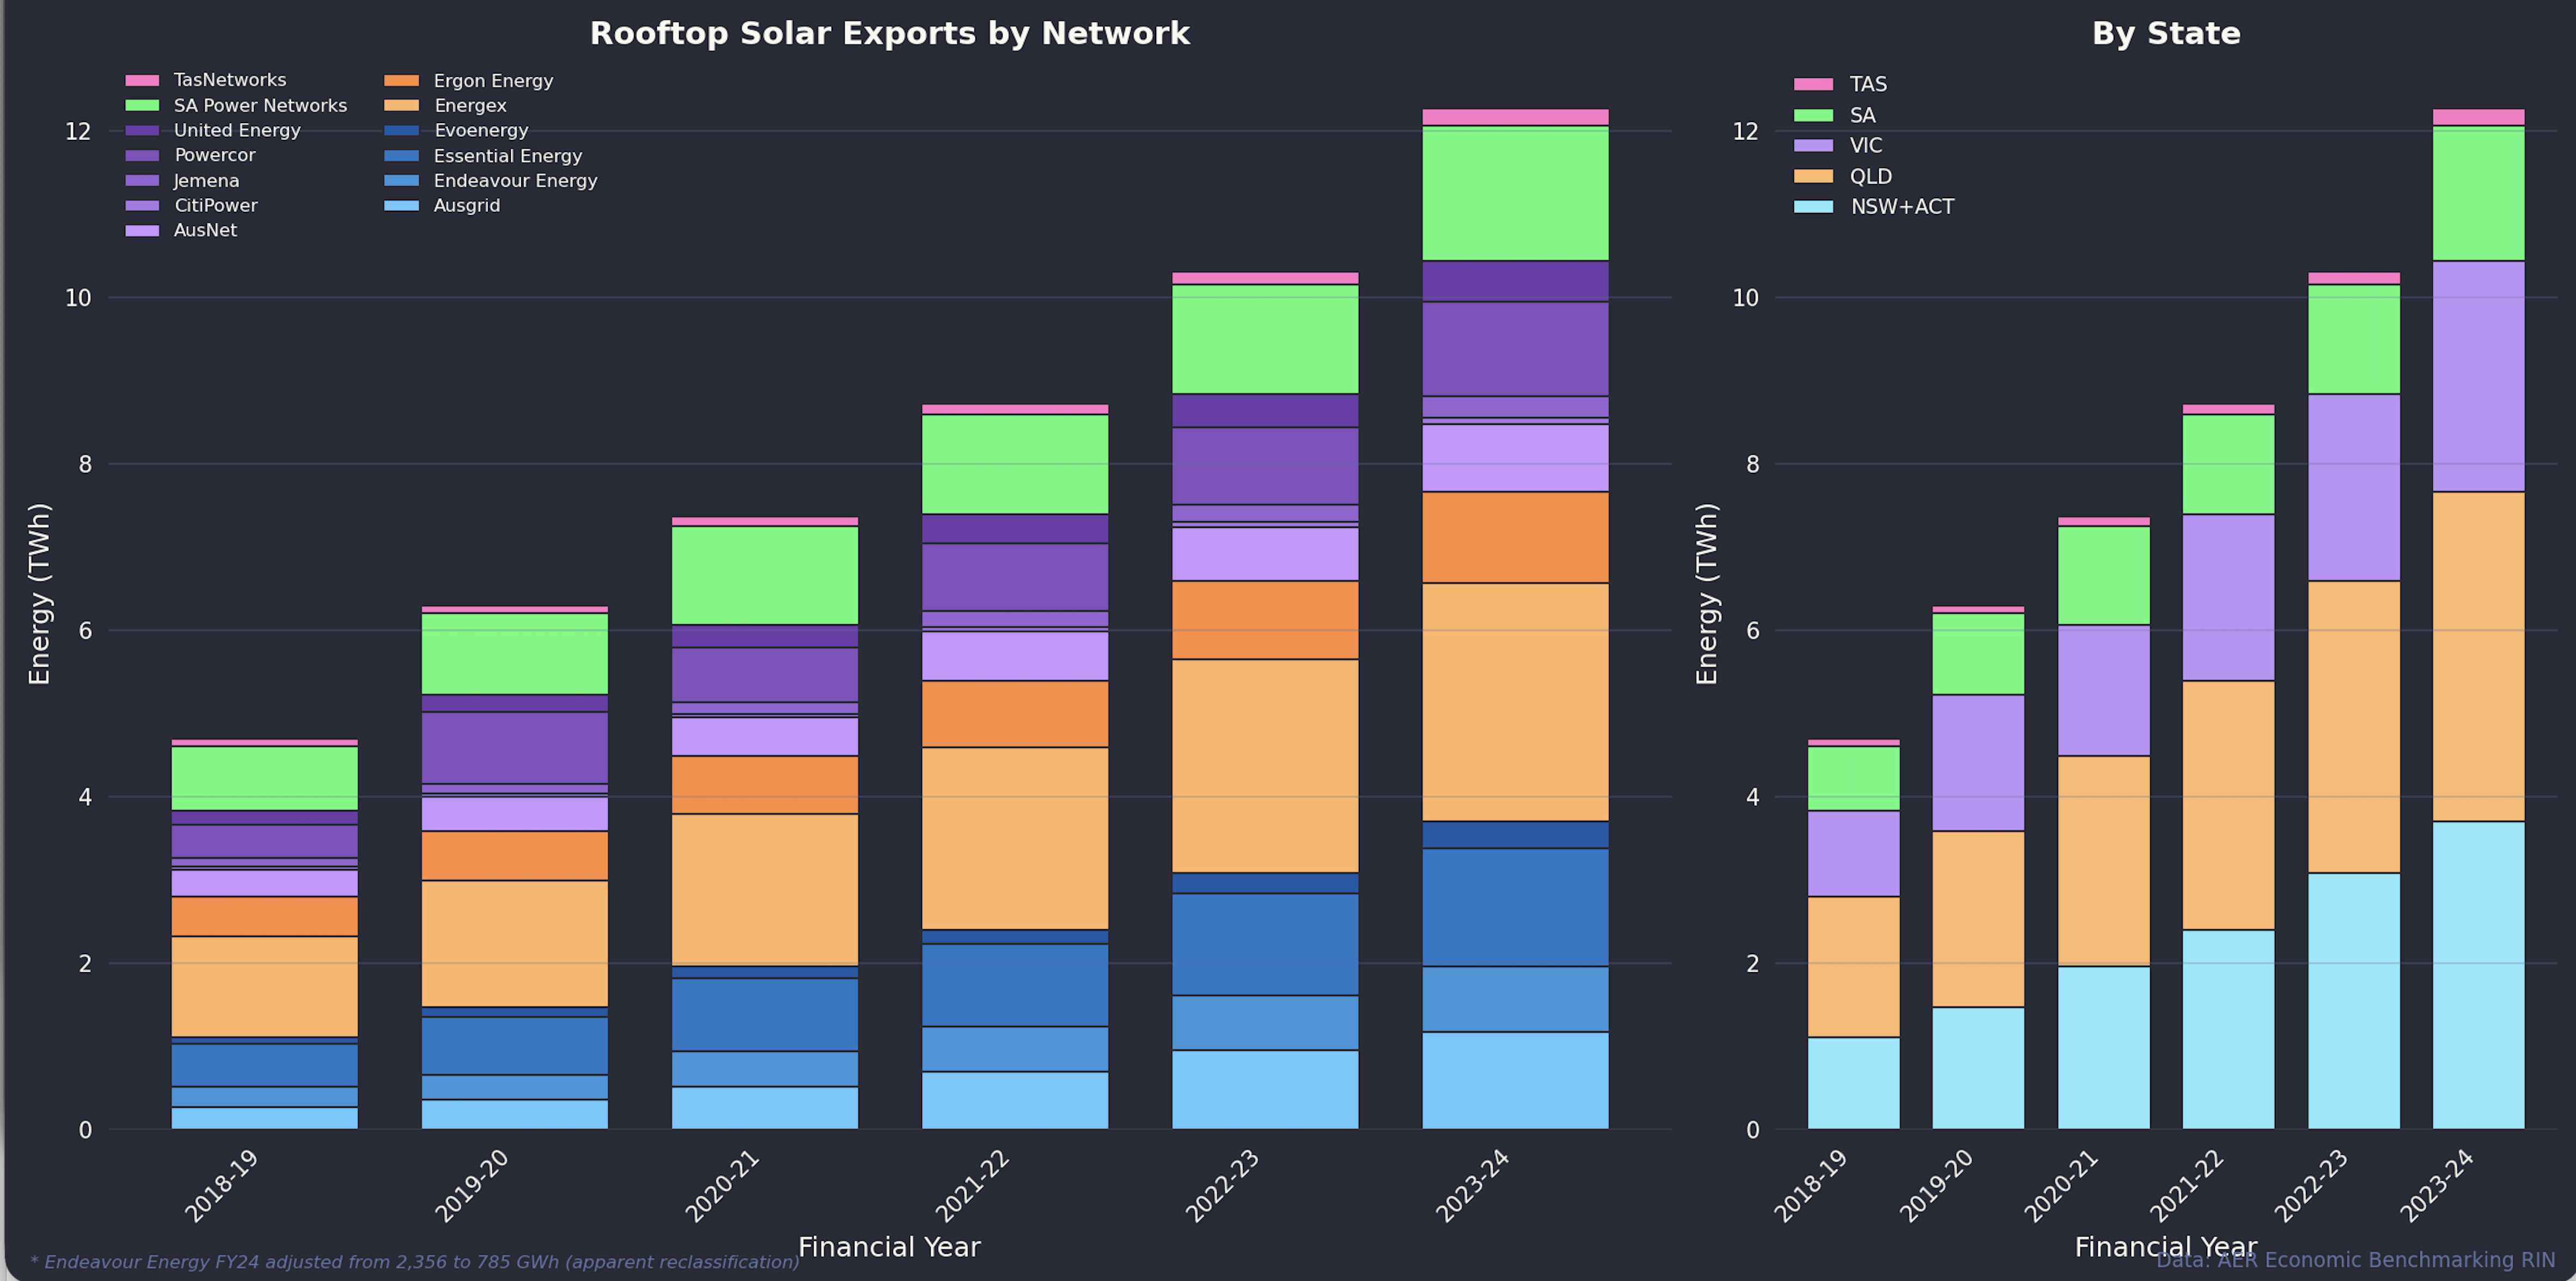
Sometimes my more ginger group country chums tell me to put a wind farm in Lindfield if they are such good ideas, but I don’t point out it’s Ausgrid and Energex that do some of the heaviest rooftop lifting.
Conclusion
The data tells a clear story: transmission-supplied volumes to distribution networks have fallen 10% since FY19, driven by rooftop solar growth, while customer numbers continue to rise. Networks face a structural challenge - their regulated revenue model assumes throughput, but throughput is declining. Home batteries will likely accelerate this trend by reducing exports. The current push for higher fixed charges is one response, but it doesn’t address the underlying policy requirment to incentivise electrification.